Overview
Load based application performance testing is critical for ensuring that your application is performing optimally throughout its lifecycle. Having the capability to perform these tests, in an automated fashion, not only allows an organization to capture initial baseline performance metrics but to analyze the impact of future application updates.
Traditional testing tools, such as LoadRunner and JMeter, excel at web application testing as they can accurately recreate a user workflow at varying load levels. (e.g. simulating multiple user sessions concurrently) Unfortunately, these tools have a few drawbacks which may limit their usefulness in some scenarios: a) Products such as LoadRunner are quite costly, b) Significant technical skill is required to create scripts, and c) Scripts may require frequent updates as the web applications and/or test cases evolve.
To mitigate some of these drawbacks while retaining the benefits of application load besting for Oracle EPM Cloud applications, Oracle has application load testing functionality in the EPM Automate tool. The EPM Automate functionality allows for the recording/playback/performance analysis of a Smart View based user session against Oracle Cloud EPM applications. As users can perform just about any activity through Smart View that they would via the web-based interface, this allows for a near real world performance analysis. While there will be some performance difference between a Smart View sequence and its corresponding web-based sequence, the comparison is close enough to allow for meaningful results. (e.g. business rules triggered via Smart View or the web U/I will not have a performance difference while page rendering may be slightly different due to the lack of a web browser rendering delay)
To complete a performance testing cycle, there are four key areas of focus:
- Pre-Requisites – Ensure that your environment is setup for supporting the performance testing process
- Test Case Recording – The recording is created by leveraging a utility, such as Fiddler, which is installed on the end user’s machine and is capable of recording internet traffic. While the user is working in Smart View, Fiddler captures messages sent to/from the Oracle EPM Cloud application and Smart View.
- Test Case Replay – After the recording is complete, the EPM Automate utility can be used to read the recording and “replay” the steps performed by the original user against PBCS. The results for each step are saved to file and can be analyzed to determine pass/fail of each step, time elapsed, etc. The utility also allows for the ability to stress test your application by running the recorded session multiple times concurrently to simulate having multiple users I the system at the same time. Depending on the test case, some tweaking may be required to make this work properly. (e.g. having 20 people run the same calc with the same POV wouldn’t make sense, etc.)
- Analysis – While EPM Automate is performing the test case replay(s), it captures performance data. This data is stored and needs to be processed for analysis. Excel is typically used for performing the performance analysis.
Pre-Requisites
You should have the following installed on your computer / available to you:
- Hyperion Smart View – https://www.oracle.com/technetwork/middleware/epm/downloads/smart-view-1112x-2412371.html
- Fiddler – https://www.telerik.com/fiddler
- Installation Instructions – https://docs.telerik.com/fiddler/Configure-Fiddler/Tasks/InstallFiddler
- Post Installation Setup – HTTPS Traffic Configuration
- Access to a PBCS/EPBCS/FCCS Instance
- EPM Cloud user accounts which will be used during the load testing step
In addition to the software requirements, you should also make sure you have the following functional items:
- Created temporary test users which will be used during the testing process (e.g. If you want to test performance w/ 20 concurrent users, create 20 temp user accounts and/or make available 20 existing user accounts)
- A test script which can be executed via Smart View which will simulate a “real world” use case. The test case should include all required steps that will be executed from Smart View (e.g. Variables to set, forms to open, calcs, etc.)
Test Case Recording
To create the recording, you will need to ensure that you have: Smart View, Telerik Fiddler, relevant connection details to the Oracle EPM Cloud product, and a script containing the instructions you will follow. Once you have that information, follow the steps below
- Starting Fiddler
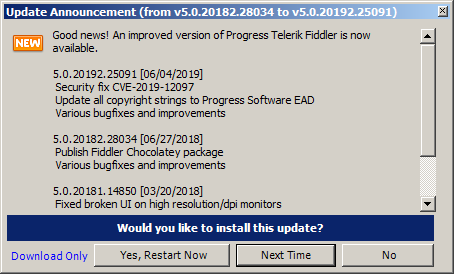
- Once you have all of your prerequisite items prepared, start Fiddler. Navigate through the welcome screens and any update prompts
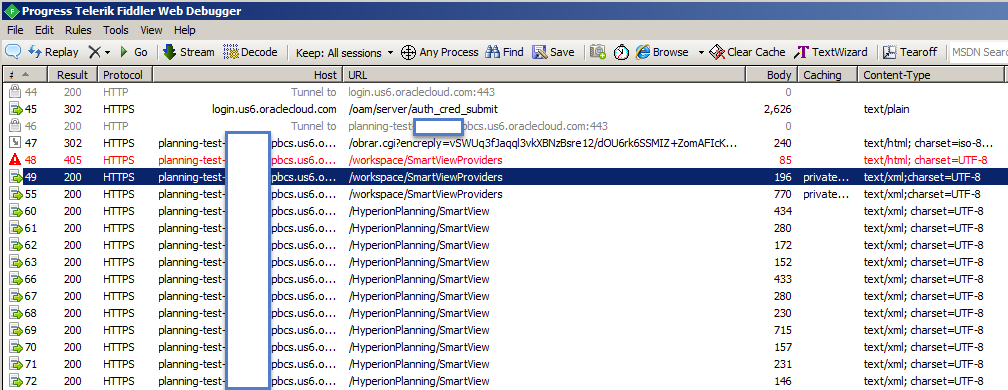
- After the initial welcome screen / update check, you will end up on the primary application screen which contains multiple windows:
- Traffic Window – this window shows a real-time activity sequence of HTTP data flowing from your PC to server end points
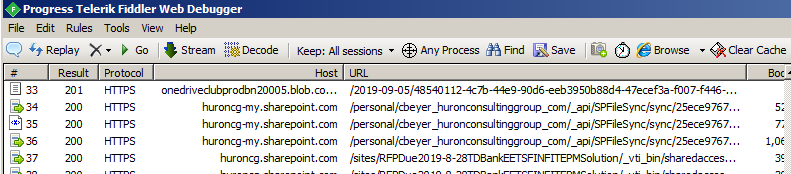
- Request Data – This tab in the upper right pane display “Request” information for the selected packet
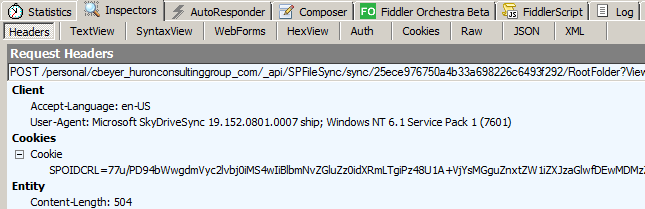
- Response Data – This table in the lower right pane displays the “Response” information for the selected packet
- Traffic Window – this window shows a real-time activity sequence of HTTP data flowing from your PC to server end points
- Once you have all of your prerequisite items prepared, start Fiddler. Navigate through the welcome screens and any update prompts
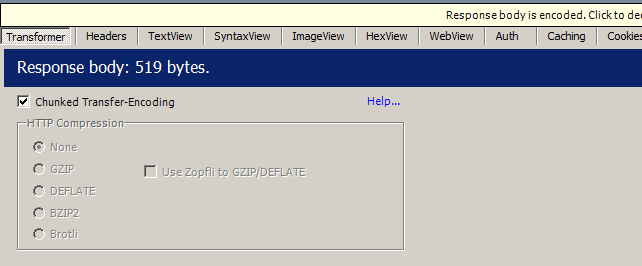
NOTE – Request Data is information sent from your machine to the web server and Response data is the associated reply from the server.
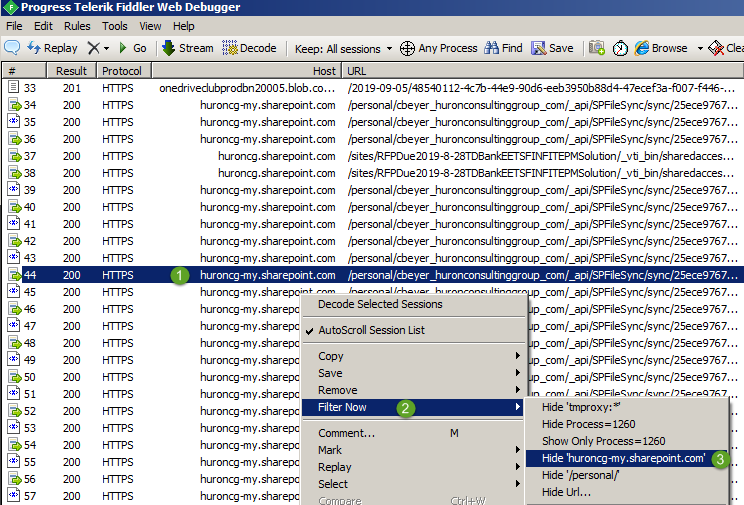
- Filter Fiddler Traffic – As you’ll quickly realize, your machine is constantly sending information back/forth which Fiddler will see. We do not want all of this extra information in our recording. Perform the following steps to eliminate redundant information:
- Close any unnecessary programs – Close all browser windows, Outlook, Excel, Word, etc., etc., etc. The only programs you’ll want to have open are an instance of Excel for Smart View, a browser window for Oracle EPM, and Fiddler.
- You may still see data flowing from Windows services or other background processes. If you still see packets appearing in the traffic window, right click on one of the messages, select the Filter Now submenu, and then pick the appropriate “Hide” option. As you will typically see a pattern around the Host (target server), filtering by Host is usually the best choice.
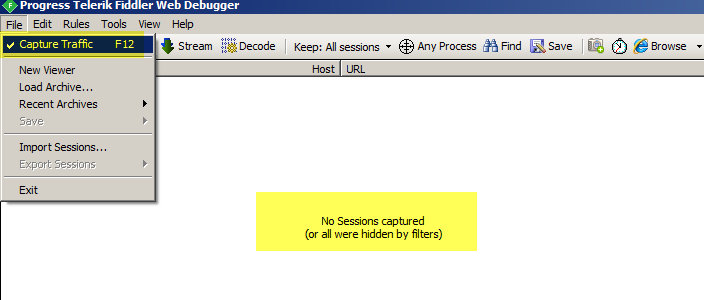
- Continue filtering until your traffic window is no longer filling up with unnecessary packets. Also, ensure that Capture Traffic is enabled to ensure you are actively monitoring for new packets.
- Start Excel, Connect to Oracle EPM, and start executing your script via the Smart View add-in
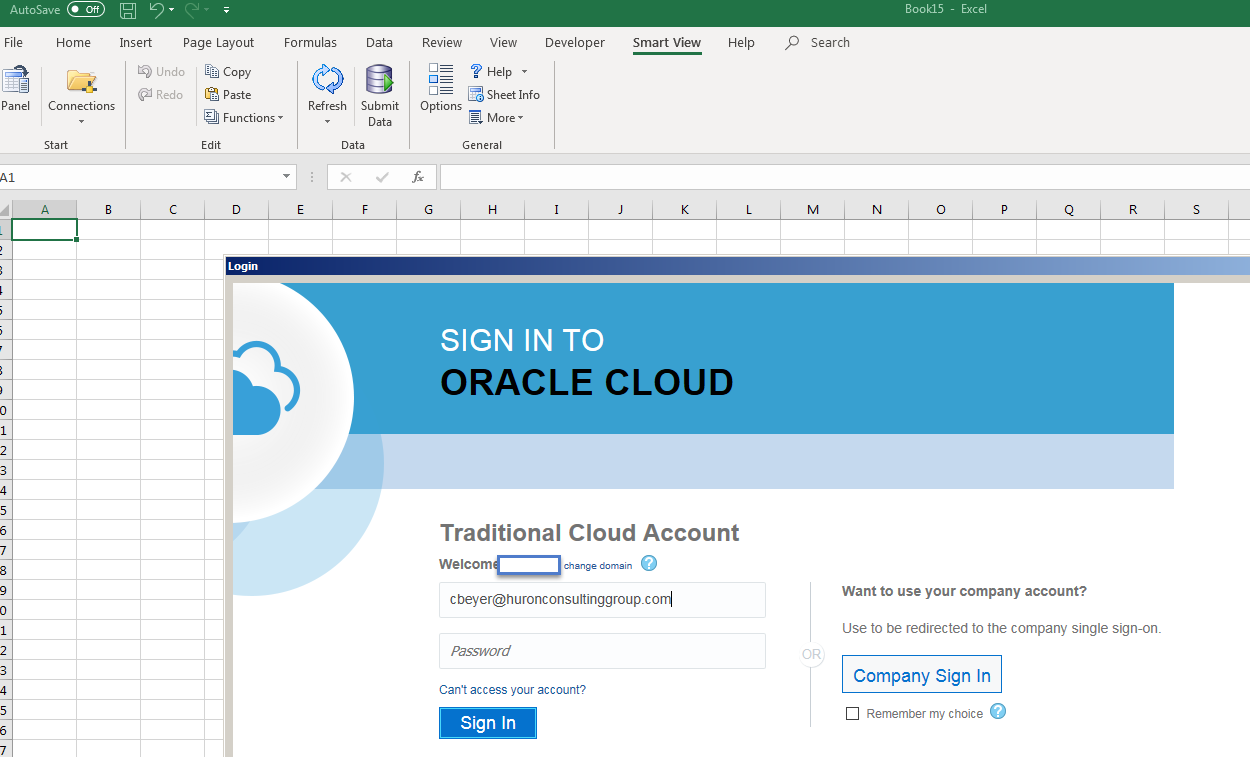
As you are working through the steps, you should see activity being captured in Fiddler which corresponds to Oracle Cloud EPM traffic
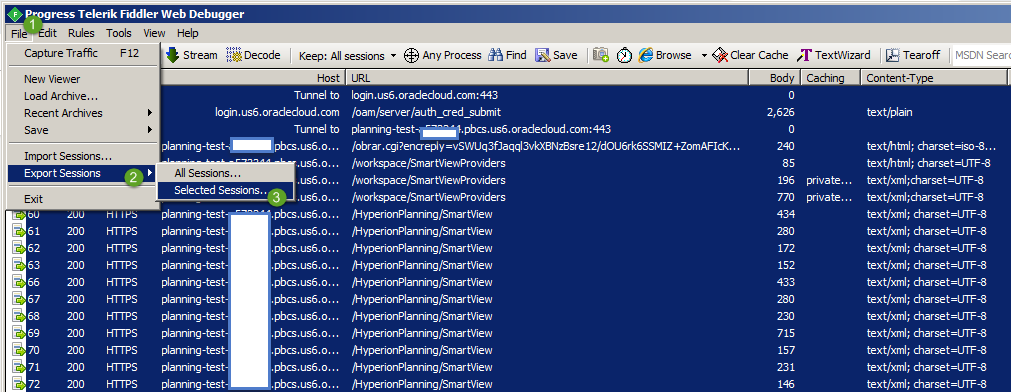
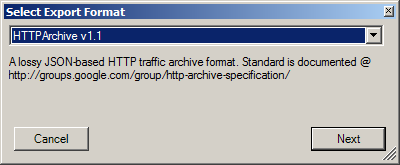
- Export the Fiddler traffic into a HTTP Archive v1.1 file (.HAR)
Notes:
- Consider creating multiple different recordings to test different use cases. Replaying the exact same script multiple times may not be a good real-world load test. (e.g. Would you really run the exact same business rule / POV concurrently?)
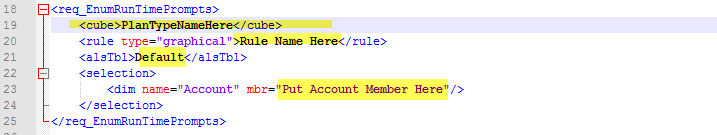
- If done carefully, you can modify the .HAR file to create unique test cases with minimal effort (e.g. Create clones of a test case which use a different “POV”, Run Time Prompt values, business rule, report name, etc.) The example below shows the information passed for execution a Business Rule. If done properly, you can alter the rule name, the cube, POV and/or RTP members.
Test Case Replay
Now that you have created a recording file for your test case, you can use EPM Automate to play it back. Perform the following steps to perform the replay testing / performance data capturing:
- Create a replay user list file – This file will be used by EPM Automate to determine how many concurrent tests will be executed. This comma delimited file will contain a list of user accounts, passwords, and the name/location of the appropriate HAR that will be executed. The sample file shown below will execute for 10 concurrent users who are all executing the same test case.

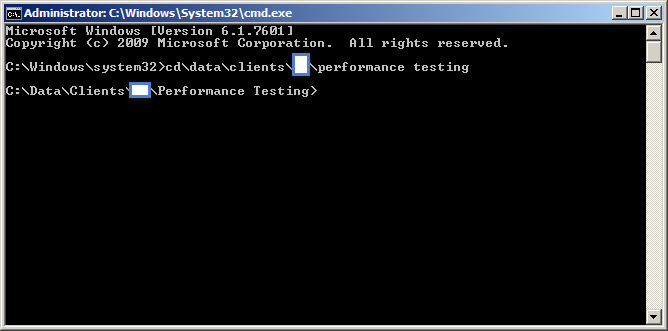
- On your testing PC, open a command prompt in Admin Mode
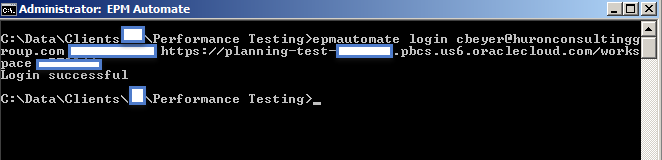
- Using EPM Automate, login as a Service Administrator
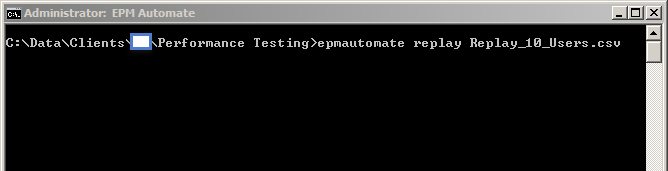
- Using EPM Automate, start the testing session by issuing the replay command.
NOTE(s)
-
- Use the output redirection symbol ( > ) to push the output to a file for late analysis
- There are additional parameters which can be passed depending on your use case. Please see the following URL for more details: https://docs.oracle.com/en/cloud/saas/enterprise-performance-management-common/cepma/appendix_replay_sample_execution.html
- Review the data output to the screen and/or to a specified output file. It should look similar to:
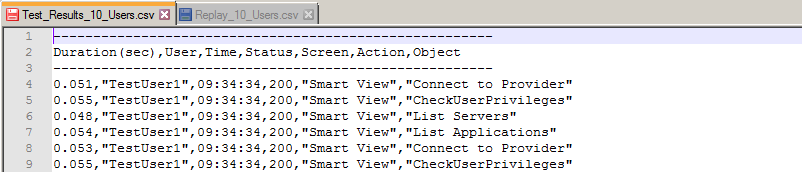
![]()
For each step in your test case, for each user, you will see a duration, username, time, HTTP status code, and action details.
Test Result Analysis
While you can manually review the output data shown above, if you want to compare multiple test iterations, you will probably need to pull the data into Excel for further analysis. For instance, you may have test output for 1 / 5 / 10 / 15 / 20 concurrent users so that you can see how well a process will scale as concurrent users are added.
In order to accomplish this comparison, you will have to do a little work in Excel as the data returned from EPM Automate isn’t consistently delimited in the output. (e.g. Business Rule execution will have multiple values in one column that need to be split to find actual Essbase provider execution times, etc.)
To fully analyze the information in the output, you will end up with columns covering:
- User Experience Duration – This is referring to timing around the User Interface and doesn’t necessarily correlate to Business Rule / Essbase performance
- Client Duration – This metric also speaks to U/I client software timing
- Total Provider Time – This metric is buried in the “Object / Addl” columns in the EPM Automate output. For operations hitting against the cube, this is a number that will reflect execution time
- Essbase Duration – While this is reported in EPM Automate output, it didn’t really seem to be useful
- Smart Push Duration – Time spent for Smart Push operations
- Business Rule Duration – While it should reflect execution duration of the business rule, it didn’t really seem to have meaningful values
- Form Validation Duration
- Total I-O Duration / Total Duration – Columns I add to calculate a grand total for an operation which may have durations for multiple categories. (e.g. Essbase, Provider, Smart Push, etc.)
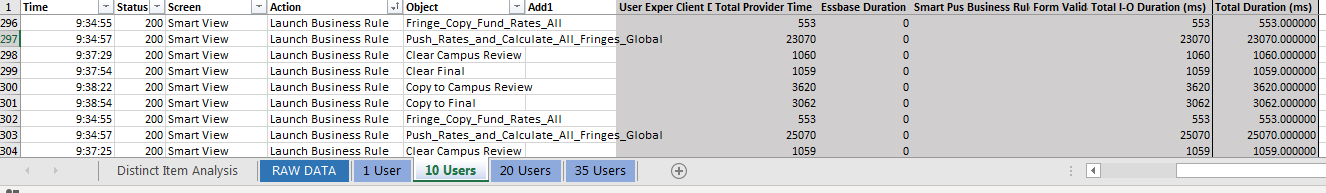
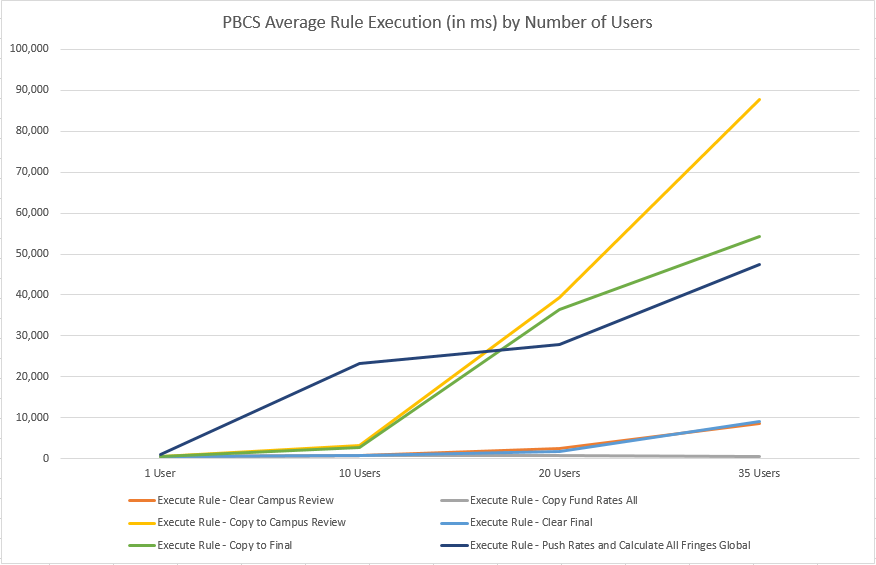
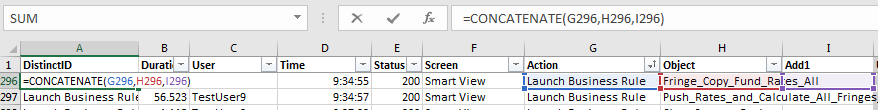
As I’m typically running tests for different user levels (1 / 10 / 20 / 35), separate worksheets exist which contain the raw data for each of the user groups. A Unique ID is generated so that the same tasks can be matched up on the user tables (e.g. Execute Business Rule “A” timing is pulled for 1/10/20/35 users)
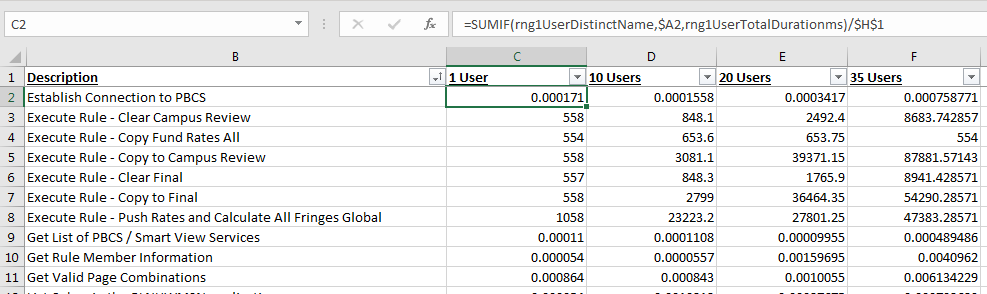
The summary tab uses the Unique IDs to display a distinct list of activities and the respective timings for each test set.
Finally, this data is used to generate presentation graphs: