Browse Category

Oracle EPM

Technology information pertaining to Oracle’s EPM platform

EPM Automate – State Management “Public Safety Announcement”

Overview

EPM Automate is an Oracle provided command line interface which is used for interfacing with Oracle Cloud EPM applications. These applications expose REST API endpoints for consumption to accomplish a wide variety of activities. (data loading, user management, maintenance, rules execution, etc., etc., etc.) The EPM Automate utility allows users to consume the REST API endpoints without having to write writing code. This is useful for application administrators and power users who wish to perform certain activities without having to navigate the applications graphical user interface. The utility can also be utilized by automation processes to reduce technical debt/maintenance overhead since it abstracts the API details.

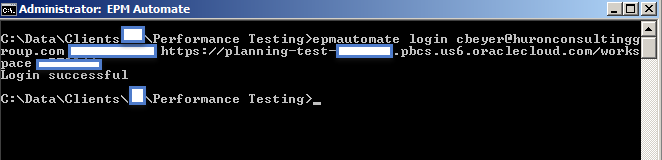
Using EPM Automate is relatively simple as you just download/install the utility, on a Windows or Linux system, and issues commands via the command line. Commands are issued one after another in the necessary sequence to perform a particular task. In the example below, I am connecting to an EPM Cloud application, requesting the value of a substitution variable, and then logging out of the application.

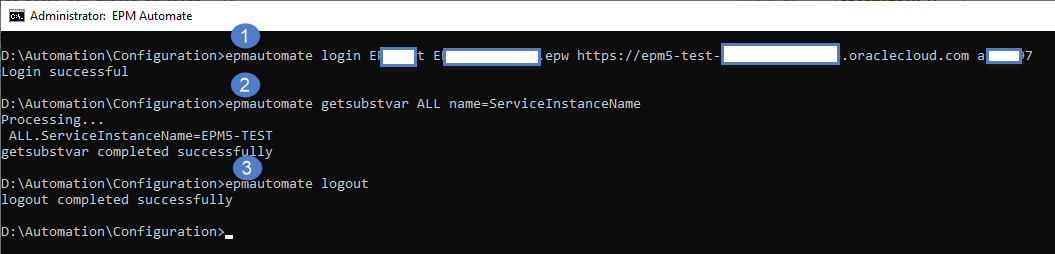
After logging into the application, you can run as many individual commands as you would like and you can leave you ‘session’ open for some time w/o having to provide authenticate again. Even though the underlying API calls are executed separately, and you are not providing credentials for each command issue, the EPM Automate utility is maintaining state behind the scenes.

While this approach is convenient for the user, it is important to understand how this is being accomplished as misuse can result in potentially serious issues! The purpose of this post is to educate you on how EPM Automate State Management behaves and how to avoid any serious issues based on its design. Additionally, I’ll provide some future update thoughts which could address the concern raised here.

State Management

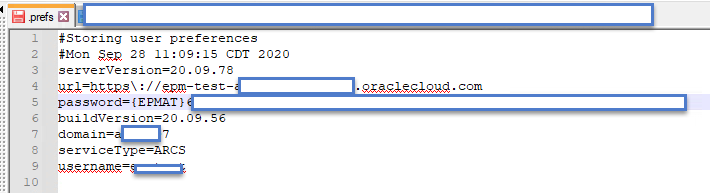
State Management is accomplished through a text file called .prefs. This file contains all of the relevant information that EPM Automate requires to communicate & authenticate with the REST API. The file is created after you successfully execute a ‘login’ command in EPM Automate.

In the early releases of the utility, Oracle stated that you should not run more than one instance of this utility at the same time. While they didn’t elaborate as to why, the issue revolved around the .prefs file. While they have made updates to the application to help address the issue, there are still some gaps which could lead to undesirable consequences.

The (mostly resolved) Issue

The issue with the .prefs file occurs when you have more than one instance of EPM Automate concurrently in use on the same machine. Originally, the .prefs file was placed in a fixed folder meaning that all instances would be reading/writing the same file and the last successful login attempt by any user on the machine would overwrite the others! If those sessions were working against the same application, not a big deal; however, if the sessions were interacting with different applications, this would be bad. The best movie analogy would be Ghostbusters’ “DON’T CROSS THE STREAMS!”

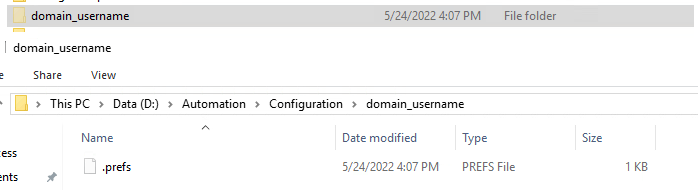
Since the original version of EPM Automate, they have adjusted this logic to allow for concurrent execution by different users. To accomplish this, the .prefs file is moved under a hidden subfolder which reflects the logged on user’s information.

By keying off of the username, this ensures that separate users will not have a collision and can operate safely.

But what happens if the same user wants to be super-efficient and do work on two different Cloud EPM applications concurrently? (it will depend, based on how careful you are!)

Crossing the Streams, for Science!

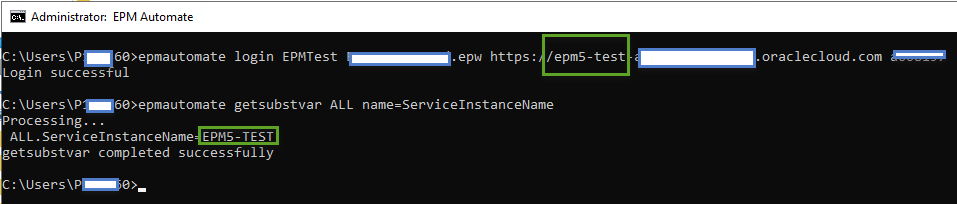
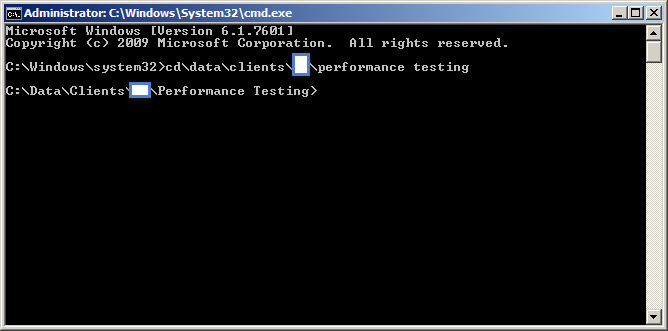
To demonstrate what could happen, we will open two separate Command Windows and just jump right into issue EPM Automate commands.

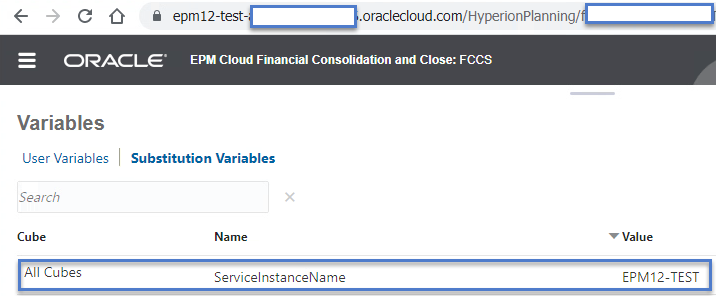
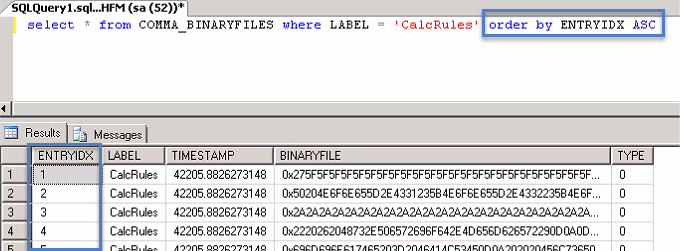
Before issuing EPM Automate commands, I’ve added a global substitution variable “ServiceInstanceName” which will hold the service instance name to two FCCS applications.

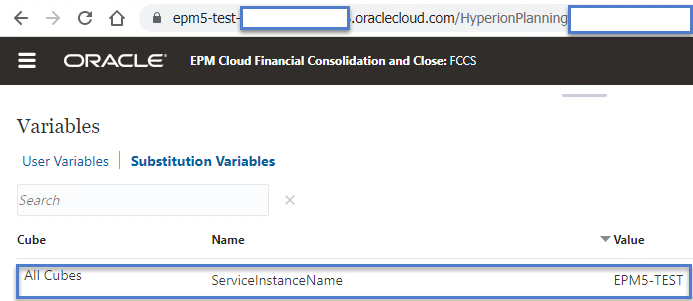
After creating the substitution variables, we will connect to one application at a time and query the substitution variable to see what we get

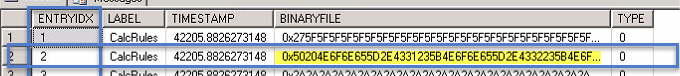
Next, let’s do the same thing for the second server:

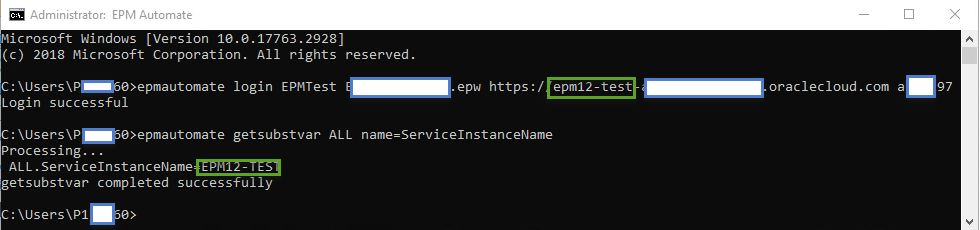
Now, let’s go back to the first window and query the variable again.

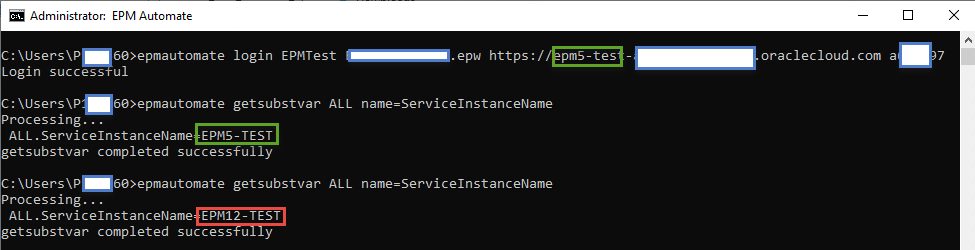
As you can see above, running two concurrent processes as the same user can lead to some undesirable results. While my example is simply reading a variable, imagine what would happen if you logged into a second application and triggered a wipe/reset of the 1st? Oops!

Easy Workaround

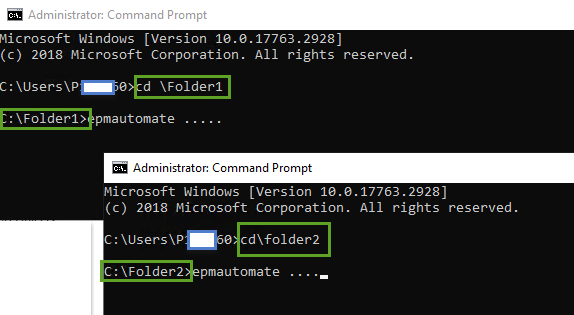
Fortunately, there is an easy workaround. Before starting your EPM Automate sessions, ensure that you are working from different folders and all will be fine since the .prefs files will be created in different locations.

Future Update Thoughts

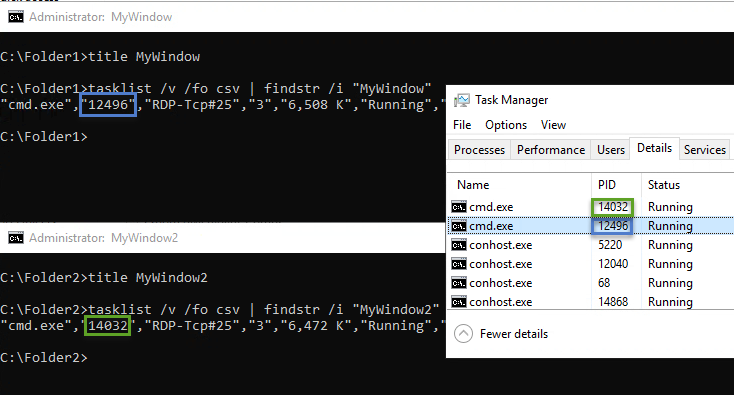
To fully prevent this issue from impacting interactive users, EPM Automate could append the Process ID (PID) to the folder name which houses the .prefs file. This would ensure that each & every command window has a distinct folder/file.

While this would be a quick/easy fix for interactive users, this would create a potential headache for anyone who is using EPM Automate in a non-interactive manner if EPM Automate commands are being issued in separate sessions. (e.g., AutoSys, Control-M, etc.). To address this, Oracle cloud add an optional command line parameter (“prefsfile”) to allow for explicitly setting the location of the .prefs file.

Performance Testing Oracle EPM Cloud Applications via Smart View / EPM Automate / Fiddler


Overview

Load based application performance testing is critical for ensuring that your application is performing optimally throughout its lifecycle. Having the capability to perform these tests, in an automated fashion, not only allows an organization to capture initial baseline performance metrics but to analyze the impact of future application updates.

Traditional testing tools, such as LoadRunner and JMeter, excel at web application testing as they can accurately recreate a user workflow at varying load levels. (e.g. simulating multiple user sessions concurrently) Unfortunately, these tools have a few drawbacks which may limit their usefulness in some scenarios: a) Products such as LoadRunner are quite costly, b) Significant technical skill is required to create scripts, and c) Scripts may require frequent updates as the web applications and/or test cases evolve.

To mitigate some of these drawbacks while retaining the benefits of application load besting for Oracle EPM Cloud applications, Oracle has application load testing functionality in the EPM Automate tool. The EPM Automate functionality allows for the recording/playback/performance analysis of a Smart View based user session against Oracle Cloud EPM applications. As users can perform just about any activity through Smart View that they would via the web-based interface, this allows for a near real world performance analysis. While there will be some performance difference between a Smart View sequence and its corresponding web-based sequence, the comparison is close enough to allow for meaningful results. (e.g. business rules triggered via Smart View or the web U/I will not have a performance difference while page rendering may be slightly different due to the lack of a web browser rendering delay)

To complete a performance testing cycle, there are four key areas of focus:

  • Pre-Requisites – Ensure that your environment is setup for supporting the performance testing process
  • Test Case Recording – The recording is created by leveraging a utility, such as Fiddler, which is installed on the end user’s machine and is capable of recording internet traffic. While the user is working in Smart View, Fiddler captures messages sent to/from the Oracle EPM Cloud application and Smart View.
  • Test Case Replay – After the recording is complete, the EPM Automate utility can be used to read the recording and “replay” the steps performed by the original user against PBCS. The results for each step are saved to file and can be analyzed to determine pass/fail of each step, time elapsed, etc. The utility also allows for the ability to stress test your application by running the recorded session multiple times concurrently to simulate having multiple users I the system at the same time. Depending on the test case, some tweaking may be required to make this work properly. (e.g. having 20 people run the same calc with the same POV wouldn’t make sense, etc.)
  • Analysis – While EPM Automate is performing the test case replay(s), it captures performance data. This data is stored and needs to be processed for analysis. Excel is typically used for performing the performance analysis.

Pre-Requisites

You should have the following installed on your computer / available to you:

In addition to the software requirements, you should also make sure you have the following functional items:

  • Created temporary test users which will be used during the testing process (e.g. If you want to test performance w/ 20 concurrent users, create 20 temp user accounts and/or make available 20 existing user accounts)
  • A test script which can be executed via Smart View which will simulate a “real world” use case. The test case should include all required steps that will be executed from Smart View (e.g. Variables to set, forms to open, calcs, etc.)

Test Case Recording

To create the recording, you will need to ensure that you have: Smart View, Telerik Fiddler, relevant connection details to the Oracle EPM Cloud product, and a script containing the instructions you will follow. Once you have that information, follow the steps below

  1. Starting Fiddler
    1. Once you have all of your prerequisite items prepared, start Fiddler. Navigate through the welcome screens and any update prompts

    2. After the initial welcome screen / update check, you will end up on the primary application screen which contains multiple windows:
      1. Traffic Window – this window shows a real-time activity sequence of HTTP data flowing from your PC to server end points

      2. Request Data – This tab in the upper right pane display “Request” information for the selected packet

      3. Response Data – This table in the lower right pane displays the “Response” information for the selected packet

NOTE – Request Data is information sent from your machine to the web server and Response data is the associated reply from the server.

  1. Filter Fiddler Traffic – As you’ll quickly realize, your machine is constantly sending information back/forth which Fiddler will see. We do not want all of this extra information in our recording. Perform the following steps to eliminate redundant information:
    1. Close any unnecessary programs – Close all browser windows, Outlook, Excel, Word, etc., etc., etc. The only programs you’ll want to have open are an instance of Excel for Smart View, a browser window for Oracle EPM, and Fiddler.
    2. You may still see data flowing from Windows services or other background processes. If you still see packets appearing in the traffic window, right click on one of the messages, select the Filter Now submenu, and then pick the appropriate “Hide” option. As you will typically see a pattern around the Host (target server), filtering by Host is usually the best choice.

    3. Continue filtering until your traffic window is no longer filling up with unnecessary packets. Also, ensure that Capture Traffic is enabled to ensure you are actively monitoring for new packets.
  2. Start Excel, Connect to Oracle EPM, and start executing your script via the Smart View add-in

As you are working through the steps, you should see activity being captured in Fiddler which corresponds to Oracle Cloud EPM traffic

  1. Export the Fiddler traffic into a HTTP Archive v1.1 file (.HAR)

Notes:

  • Consider creating multiple different recordings to test different use cases. Replaying the exact same script multiple times may not be a good real-world load test. (e.g. Would you really run the exact same business rule / POV concurrently?)
  • If done carefully, you can modify the .HAR file to create unique test cases with minimal effort (e.g. Create clones of a test case which use a different “POV”, Run Time Prompt values, business rule, report name, etc.) The example below shows the information passed for execution a Business Rule. If done properly, you can alter the rule name, the cube, POV and/or RTP members.

Test Case Replay

Now that you have created a recording file for your test case, you can use EPM Automate to play it back. Perform the following steps to perform the replay testing / performance data capturing:

  1. Create a replay user list file – This file will be used by EPM Automate to determine how many concurrent tests will be executed. This comma delimited file will contain a list of user accounts, passwords, and the name/location of the appropriate HAR that will be executed. The sample file shown below will execute for 10 concurrent users who are all executing the same test case.

  2. On your testing PC, open a command prompt in Admin Mode

  3. Using EPM Automate, login as a Service Administrator

  4. Using EPM Automate, start the testing session by issuing the replay command.

NOTE(s)

  1. Review the data output to the screen and/or to a specified output file. It should look similar to:

For each step in your test case, for each user, you will see a duration, username, time, HTTP status code, and action details.

Test Result Analysis

While you can manually review the output data shown above, if you want to compare multiple test iterations, you will probably need to pull the data into Excel for further analysis. For instance, you may have test output for 1 / 5 / 10 / 15 / 20 concurrent users so that you can see how well a process will scale as concurrent users are added.

In order to accomplish this comparison, you will have to do a little work in Excel as the data returned from EPM Automate isn’t consistently delimited in the output. (e.g. Business Rule execution will have multiple values in one column that need to be split to find actual Essbase provider execution times, etc.)

To fully analyze the information in the output, you will end up with columns covering:

  • User Experience Duration – This is referring to timing around the User Interface and doesn’t necessarily correlate to Business Rule / Essbase performance
  • Client Duration – This metric also speaks to U/I client software timing
  • Total Provider Time – This metric is buried in the “Object / Addl” columns in the EPM Automate output. For operations hitting against the cube, this is a number that will reflect execution time
  • Essbase Duration – While this is reported in EPM Automate output, it didn’t really seem to be useful
  • Smart Push Duration – Time spent for Smart Push operations
  • Business Rule Duration – While it should reflect execution duration of the business rule, it didn’t really seem to have meaningful values
  • Form Validation Duration
  • Total I-O Duration / Total Duration – Columns I add to calculate a grand total for an operation which may have durations for multiple categories. (e.g. Essbase, Provider, Smart Push, etc.)

As I’m typically running tests for different user levels (1 / 10 / 20 / 35), separate worksheets exist which contain the raw data for each of the user groups. A Unique ID is generated so that the same tasks can be matched up on the user tables (e.g. Execute Business Rule “A” timing is pulled for 1/10/20/35 users)

The summary tab uses the Unique IDs to display a distinct list of activities and the respective timings for each test set.

Finally, this data is used to generate presentation graphs:

Resolving Frozen HFM Applications

Overview

While Hyperion Financial Management (HFM) applications do not regularly suffer from technical issues, there are certain situations that can cause your application to become unresponsive. This scenario usually is caused by poorly designed or corrupted HFM member list or calculation rules which run in a loop. (e.g. self-referencing member lists) When this happens, the application becomes frozen and even a restart of the servers/application will fail to solve the issue since the rules are executed again on startup.

One way to resolve this issue is to revert to a backup; however, this could result in the loss of artifacts and/or data. Fortunately, there is a better way to solve this problem that will minimize downtime and prevent the loss of information!

The information provided below will cover key details and complete recovery steps using the HFM COMMA application as an example.

HFM Database Concepts (Rule File Storage)

While the HFM relational database contains a plethora of tables, one table (<appname>_BINARYFILES) contains the key to this solution. HFM Rules, Metadata, Member Lists, and other Application Settings are all stored in this table. (see my other post about altering HFM Starting years via this table for more information!) When you use the HFM user interface to import Rules / Member lists / Metadata to the application, the information is placed in the appropriate instance of the table. (e.g. COMMA_BINARYFILES) The LABEL column indicates what type of information is being stored (AppSettings, CalcRules, MemberListRules, SharedAppData, etc.) while the BINARYFILE column contains the data.

Since the BINARYFILE column can only contain 2,000 bytes of data, you will find multiple rows of for a given type. (e.g. Rules files will typically have numerous rows since rule files are typically much larger than 2,000 bytes) When the data needs to be used in the application, it is read in ascending order based on the ENTRYIDX column.

.

While the BINARYFILE data does not appear to be readable, it is simply the ASCII values stored as a string as opposed to the actual human readable characters. The beginning of the 2nd row has been decoded for reference:


Resolving HFM App Hang Up

While the HFM database table ‘history lesson’ was fun, how exactly does this solve the problem? Since the HFM application is looking for specific LABEL values for Rules / Member Lists, the easiest way to resolve the issue is to update the LABEL for the relevant rows so that HFM will no longer “see” them as rules / member lists. This will effectively give HFM a clear slate and it will startup as expected. (Before doing anything with the application you should re-load a good set of rules / members though!)

IMPORTANT – You should not make these changes while the application is running! Be sure to stop the application first!

The following steps should be followed to fully recover the application:

  1. ​Stop HFM Services
  2. Connect to the database and execute a query to change the Label value to a dummy value
    • Member Lists – UPDATE <APPNAME>_BINARYFILES SET LABEL = ‘BadMemberListRules’ WHERE LABEL = ‘MemberListRules’
    • HFM Rules – UPDATE <APPNAME>_BINARYFILES SET LABEL = ‘BadCalcRules’ WHERE LABEL = ‘CalcRules’
  3. Restart HFM Services
  4. Connect to Application
  5. Load new Member List or HFM Rules
    • NOTE – If this is an EPMA application or you are using Calculation Manager, be sure to correct the rule issue and redeploy the application


Oracle Inventory User Maintenance Scenarios

Overview

The Oracle Inventory is a series of registry entries and files that keep track of all Oracle products / patches that are installed on a machine. As certain portions of Oracle Inventory are stored in a user specific manner, product and patching problems can occur if multiple user accounts are utilized for product installation and/or patching operations. (e.g. User 1 installs Product A, and User 2 attempts to patch Product A)

Common Oracle Inventory / User related scenarios / solutions are:

  1. A user account is used to install software / apply patches and this account is disabled / deleted at a later date – Assuming no additional Oracle software has been installed, this is easy to fix via a combination of file copy / registry updates.
  2. Multiple user accounts have been used to install Oracle Software – In this scenario, the inventory needs to be recreated under one user regardless as to whether the accounts exist or not.

[IMPORTANT – It is strongly recommended to install/patch all software with a non-user specific account, where possible.  While certain security policies may not allow this, using a global account will ensure you do not have to perform the steps in this document.  ]

Prior install account has been disabled / deleted

In this scenario, an account used to install the Oracle EPM Software has been disabled / deleted and we are unable to patch the environment as the Oracle Inventory for the current user does not have knowledge of the prior installed products. The recommended fix is to reassign the previous user account’s Oracle Inventory to the new user account.

To move the Oracle Inventory, perform the following steps:

  1. Identify service account and setup with local administrator access on all Hyperion machines
  2. Copy .oracle.instances file from the user account which was used previously to the new account. In the example below, the user was epm_admin making the path to the file C:\Users\epm_admin\.oracle.instances.
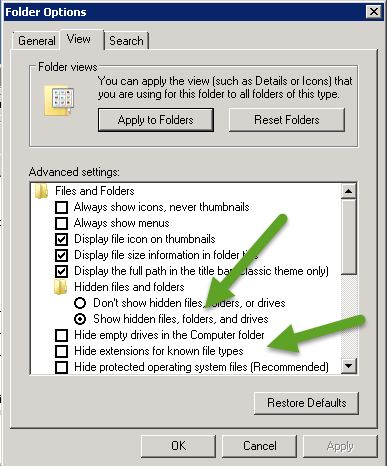
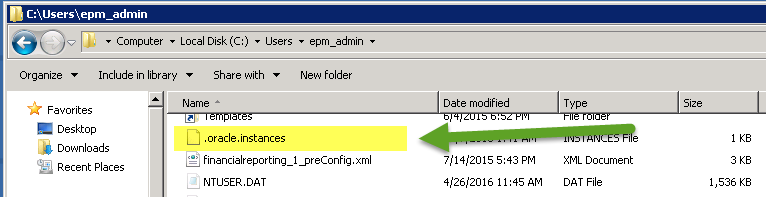
NOTE: This file may not be visible depending on your file folder view settings.

  3. Modify Windows Registry Hive & Key values – Replace the old install user with the new one
    1. Rename Computer\HKEY_LOCAL_MACHINE\SOFTWARE\ORACLE\KEY_EpmSystem_<old user>
    2. Update the values for ORACLE_GROUP_NAME & ORACLE_HOME_NAME keys so that they refer to the new user account.


  1. Modify file C:\Program Files\Oracle\Inventory\ContentsXML\inventory.xml

Replace any reference to the old install account with the new account

  1. Confirm OPatch software shows inventory properly by:
    1. Opening a Windows Administrator Command Prompt
    2. Navigate to the Oracle\Middleware\EPMSystem11R1\OPatch folder
    3. Execute the Opatch utility:Opatch lsinventory –oh <Install Drive>:\Oracle\Middleware\EPMSystem11R1 –jdk <Install Drive>:\Oracle\Middleware\jdk160_21
    4. Visually verify that the installed patch list corresponds with what has been installed

Oracle products have been installed to multiple accounts

In this scenario, multiple accounts have been used to install Oracle software. Patching attempts may fail or appear to operate successfully, though not all products are truly updated. To resolve this issue, the Oracle Inventory will need to be rebuilt targeting one user account.

NOTE: It is strongly recommended that a generic/service account is used for Oracle installation / patching to prevent these issues.

To rebuild the Oracle Inventory, perform the following steps:

  1. Log onto the server as the account which will contain the Oracle Inventory
  2. Execute the createInventory.bat script located in the <Install Drive>:\Oracle\Middleware\EPMSystem11R1\Opatch

Screen Clipping

  1. From the main menu, click on the Install menuScreen Clipping
  2. Scroll through the contents list to confirm that all installed products are reflectedScreen Clipping
  3. Monitor the Installation progress.NOTE: This may run for a while, > 10 minutes

    Screen Clipping

  4. On the Specify Source Location screen, provide the location of the products.xml file.NOTE: Should be <Install Drive>:\Oracle\Middleware\EPMSystem11R1\common\epmstage\Disk1\stage\products.xml

    Screen Clipping

  5. Specify the Oracle Inventory Home DetailsNOTE: By default this is OUIHome / C:\OraHome, use OUIHome1 & C:\OraHome1

    Screen Clipping

  6. Scroll through the provided list and ensure your products are shown and then click NextScreen Clipping
  7. Review items on the summary screen and click InstallScreen Clipping
  8. Upon completion of steps above, re-run the Opatch utility to confirm installed products now appearScreen Clipping

FDMEE Essbase/Planning Script Execution Glitch

FDMEE Essbase/Planning Script Execution Glitch

When targeting Essbase/Planning applications through FDMEE, a particularly useful feature is the ability to trigger Calculation scripts before and after the Load process as well as before and after the Check process. Not only can you execute scripts, but you can control the execution order and pass script parameters. This functionality is quite useful for executing fixed scope data clear operations before the data load and executing targeting aggregation/calculations after the data load has been completed.

Figure 1 – FDMEE Target Application Calculation Script Editor

While this feature works great when the scripts are working, what happens when there is a script failure? If a script executed during the Load process fails, should the FDMEE Load step report a failure? (even if the data loaded?) How about a script failure during the Check step? Would you be surprised to know that currently in 11.1.2.4.210, this is not the case?

In the event of a successful load process, even if a script error occurred, all FDMEE “fish” steps will return gold and the Process Monitor report will reflect the same. (e.g. no issues) Your only indication of a failure will be in the job log for the data load process!

If you are currently leveraging this functionality, please be aware of this quirk until this is corrected!

NOTE(s):

  • 11.1.2.4.100 (Patch 20648390) advertises this as being fixed; however, it still presents itself in 11.1.2.4.200+ [See Defect: 20631385]
  • An enhancement request, 25217240, was created for this issue when submitted in 11.1.2.4.200. I do not know if this has been implemented yet; however, no fix is listed in the Defects Fixed Finders Tool through 11.1.2.4.210

Steps to Recreate [target a non-existent script]

#1 – Create FDM Target Planning Application and associate a Calculation script that does not exist in the target application


Figure 2 – Create Calculation Script references for our sample Target Application

#2 – Create your Location / Data Load Maps / Data Load Rule / etc.

#3 – Load a data file through and confirm that the Process Monitor reflects success.


Figure 3 – Perform a data load and confirm that the Process Monitor User Interface shows no errors

#4 – Pull Process Monitor report and confirm no errors reflected.


Figure 4 – Run the Process Monitor Report to verify it also does not reflect any errors

#5 – Review the log file

Since the script doesn’t exist, the FDMEE log will reflect an Essbase error due to the non-existent script.


Figure 5 – Review the Job log to verify an error is reflected in the logs

Version Information:


Figure 6 – Confirm version of FDMEE

Workaround

If your load process is being performed manually, the easiest recommendation is to have users review the log to confirm successful script execution.

If you are performing automated processing where it is not feasible to manually review logs, considering implementing an Event script to scan the log file for script success/failure and using that to trigger a failure in FDMEE / Error Log / Email Notification / etc.